Linear array growth in MongoDB
Table of contents
In this post, I’ll explain an issue I stumbled upon in a real-world application backed by MongoDB, and we’ll see how manipulating even relatively small arrays can be surprisingly tricky.
You’ll find some code reproducing the examples mentioned below in this repo.
30-second introduction to MongoDB
For those who are not familiar with MongoDB, here are the only bits you need to understand for what comes next.
MongoDB is a non-relational database that allows storing JSON-like objects1 (called documents). Contrary to relational databases, it typically does not enforce a schema: the documents in a collection (which is roughly the equivalent of a relational table) can have different fields, and a field’s type can differ depending on the document.
But apart from this, just like most RDBMS, it supports indexing, transactions, aggregations, sharding, replication and multi-node deployments, and like many other databases it uses write-ahead logging and caches data pages; so any engineer familiar with good-old RDBMS and these concepts won’t feel lost here.
A trivial-looking use-case
Let me now present a very slightly simplified version of the real-world problem I mentioned above.
Let’s assume we have built a job orchestrator backed by MongoDB. This application stores a list of jobs in a collection, with one document per job. In each document, we’ll store some information about the task to be performed, such as the job’s name, the command to be executed, the job’s cron schedule, etc. A job document may look like this:
1{
2  "job_id": "my_scheduled_job",
3  "schedule": "some cron expression",
4  "command": "rsync /src /dest",
5}
Some of these jobs would be recurring, and we may want to store data about the past executions of a job, such as the start and end timestamps, the command’s exit status, etc. For the sake of simplicity, let’s assume we only want to store the timestamp when the job was executed.
A natural data type to store these would be a JSON array, which MongoDB supports. We could hence add a timestamps field to the above document “schema”, and append the job’s execution timestamps to it. The structure of our job document would then look like this:
1{
2  "job_id": "my_scheduled_job",
3  "schedule": "some cron expression",
4  "command": "rsync /src /dest",
5  "timestamps": [1784106933, 1784106943, ...], // An array of Unix timestamps
6}
The typical access pattern for this document would be to load the document (via find) every couple of seconds, execute its command if needed, then update the document by $pushing the current timestamp in the timestamps array.
MongoDB’s documentation recommends to avoid unbounded arrays, and specifically mentions the upper-bound of 16MB per document. So let’s do some back-of-the-envelope calculation. Let’s assume these timestamps are stored as 64-bit integers, and that we’ll only store the first 100,000 timestamps; we should then end up storing at most 800KB of data per document. This is well below the 16MB limit mentioned above, and shouldn’t be that intimidating for a web-scale database, right?
So let’s give it a try: we’ll create a single job document in a test collection, and then iteratively $push the current timestamp in the timestamps field; and we’ll do that only 40,000 times, to remain well below the maximum document size. You’ll find in the demos git repo some source code doing roughly that, in case you want to run this at home.
What we expected to see
What kind of system resource usage are we expecting here? My first instinct would be:
- disk usage will barely budge, as we’ll only insert about 40,000 64-bit integers into the database: the amount of data saved on disk should be negligible;
- and a flat number of IO operations per second, as we are adding a stable amount of data to the database every time we push a new timestamp.
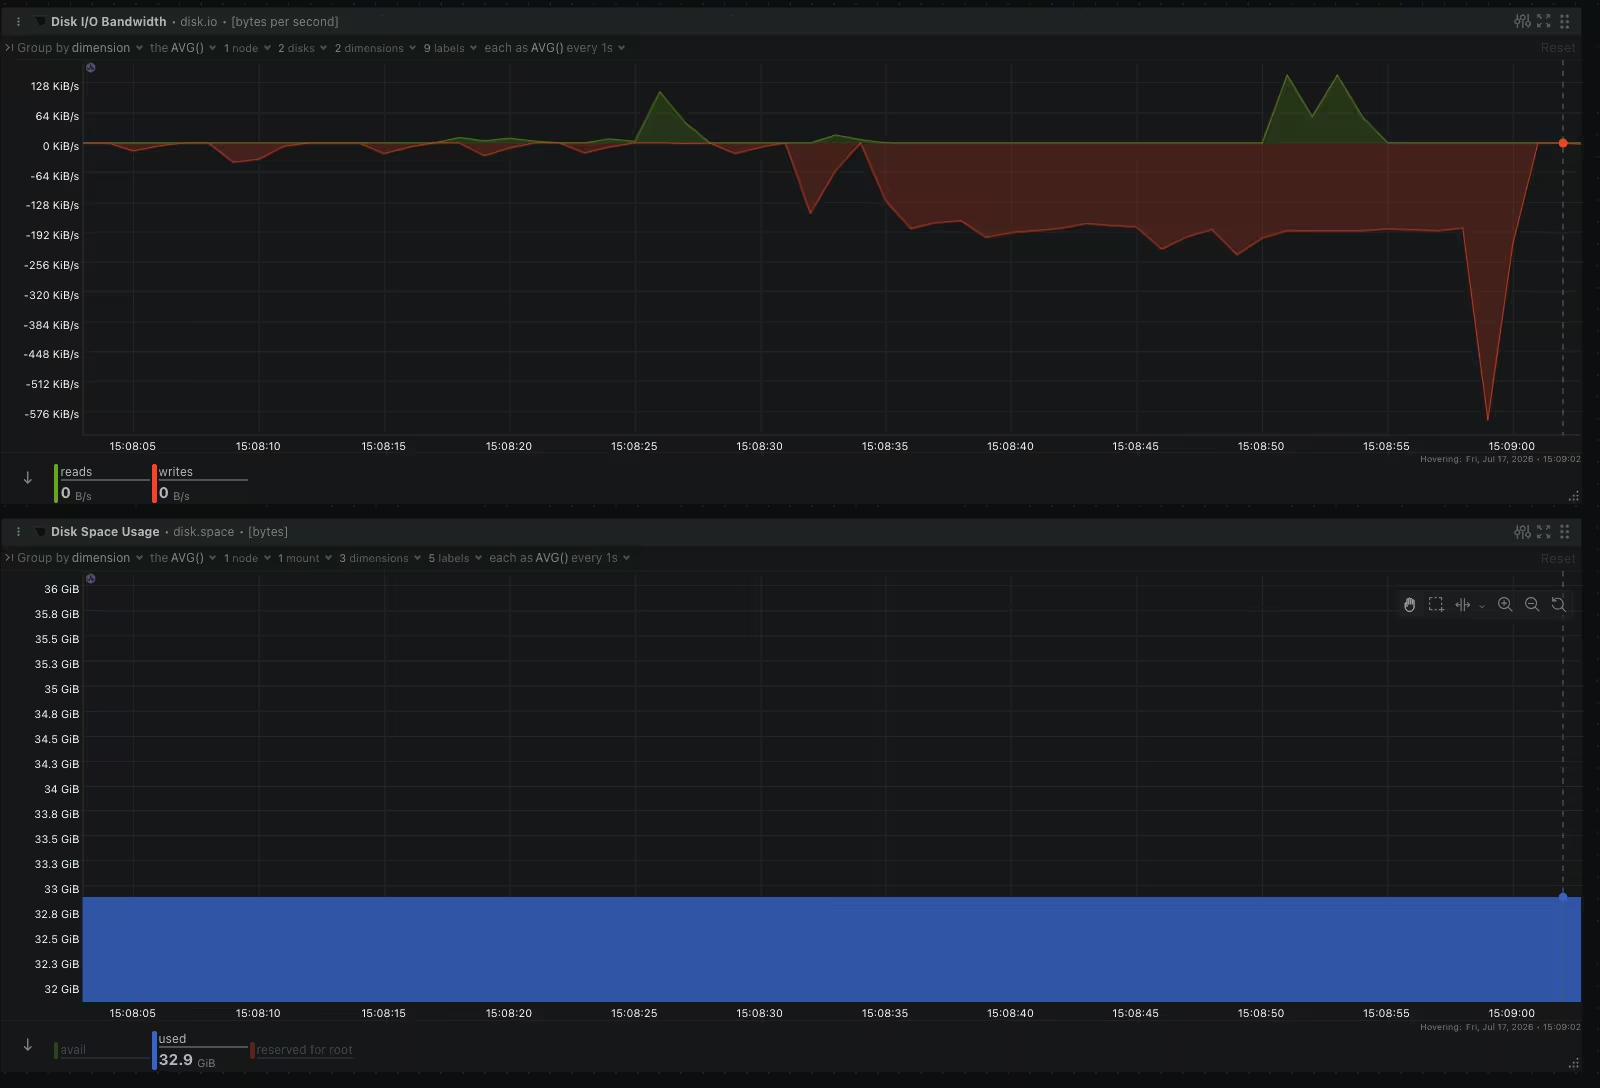
To make sure our intuition is not completely off, we can first run a very slightly different test: instead of pushing timestamps into a single document, we would insert a new document into the database for every new timestamp2. And indeed, if we do that and look at the IO and disk usage metrics in the netdata dashboard (cf. the screenshot below), we’ll see that the disk usage (in blue) is barely moving, and the IO bandwidth seems stable and rather low, plateauing around 200KB/s of data written to disk.
Surprise!
So now let’s go back to our first idea, which was to sequentially $push timestamps in a single document’s timestamps array.
We can do that by running the demo project (./target/release/linear-array-growth-db 40000, cf. the README for further guidance on how to run the test at home). If we observe the same dashboard we already looked at during the sequential insertion test mentioned just above, we’ll see a completely different story3.
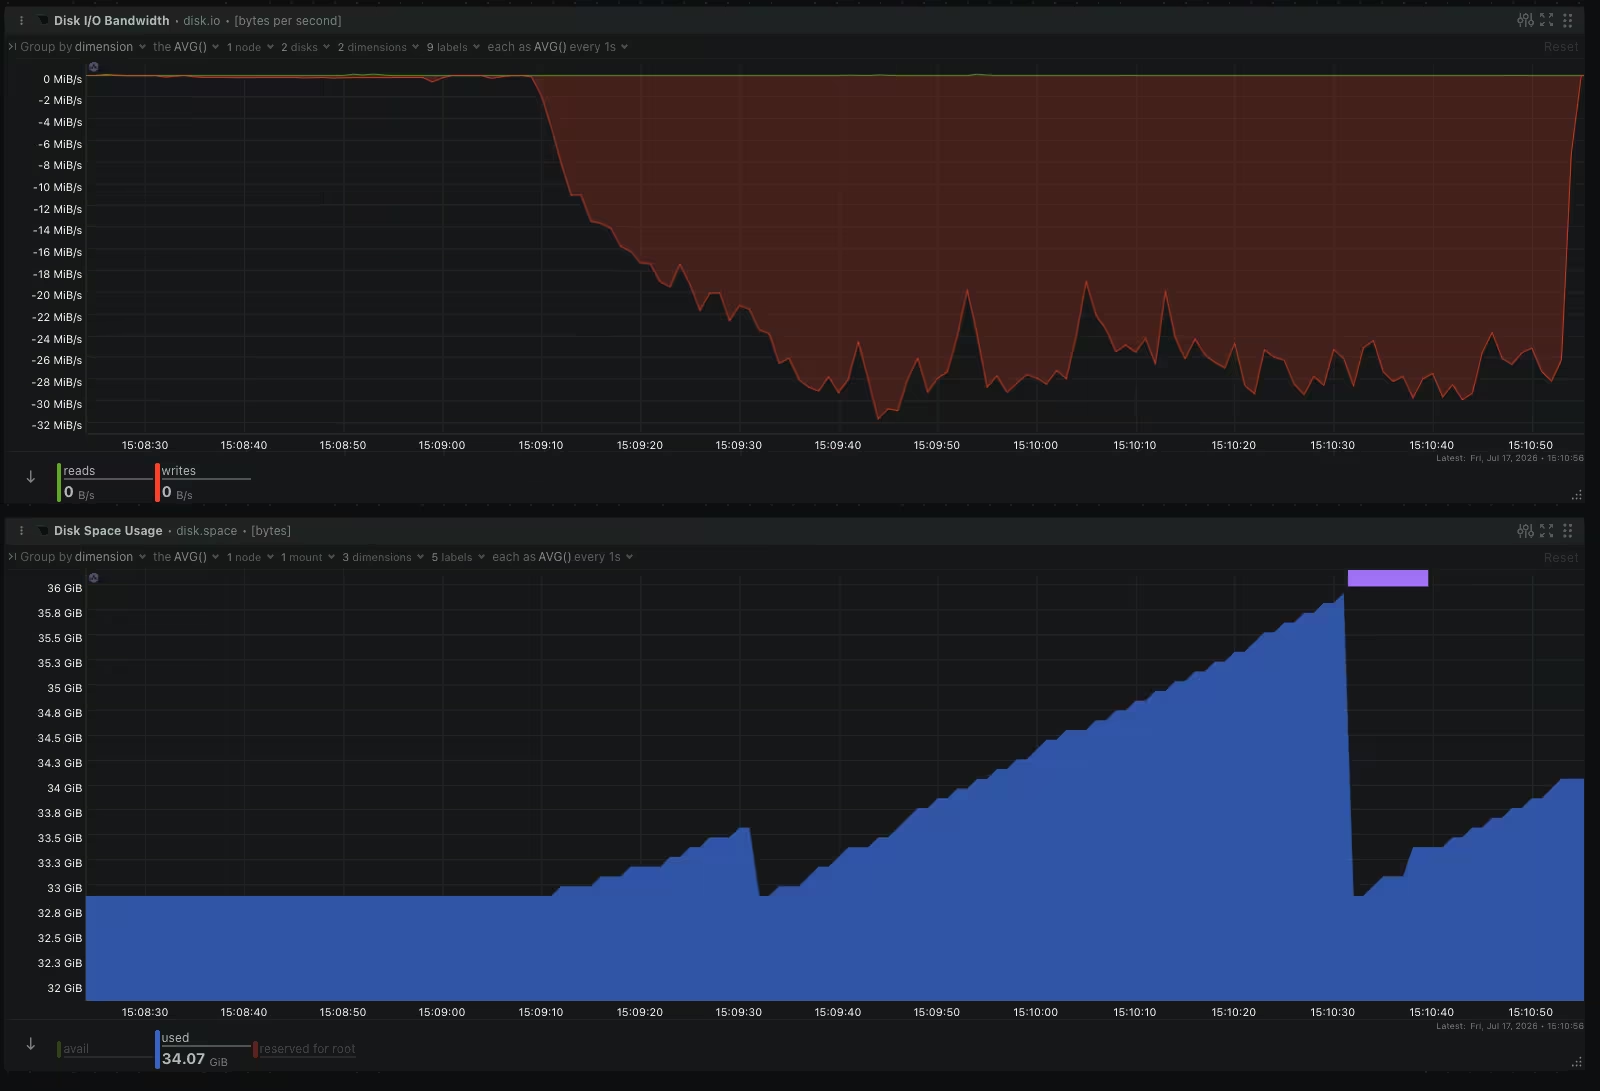
It would be an understatement to say that these metrics are not what we expected:
- the amount of IO per second goes through the roof: it gradually increases up to roughly 30MB/s of data written to disk;
- the disk space usage grows way faster than it did during the sequential insertion test, reaching up to +3GB (compared to the initial usage), and seems to randomly drop back to something close to its initial value in the middle of the test.
So MongoDB is clearly writing to disk way more than we expected: even though we are only inserting less than 1MB of actual data into the DB, these metrics show that MongoDB has written more than 3GB of data to disk!
Investigating high disk IO usage
At this point, I have no clue what MongoDB is writing at such a high volume; so the most natural way to start looking into it would be to figure out, for instance, which files are being written by MongoDB during the tests. There are several ways to do this; for this example, I’ll use sysdig and the topfiles_bytes chisel. Running this during the test execution will show something like this:
$ sudo sysdig -c topfiles_bytes
Bytes               Filename
--------------------------------------------------------------------------------
32.98M              /data/db/journal/WiredTigerLog.0000000217
624.00KB            /data/db/collection-785985d9-8bd1-4e46-bc6a-8bf80b78d7ca.wt
8.16KB              /proc/meminfo
4.47KB              /proc/self/mountinfo
3.77KB              /host/proc/interrupts
3.38KB              /host/proc/219022/net/netstat
3.38KB              /proc/net/netstat
3.14KB              /host/proc/vmstat
3.14KB              /proc/vmstat
Only the first two lines are relevant here. The second line shows some activity for the file /data/db/collection-<some-uuid>.wt, which is the file where MongoDB stores its data: so this is definitely expected.
But we can see that the file concentrating, by far, most of the written bytes is actually /data/db/journal/WiredTigerLog.<some-sequence-number>. A little bit of research tells us that this file is used by MongoDB’s storage engine (WiredTiger) for its write-ahead log: this is the file where the storage engine stores the sequence of write operations.
I couldn’t find any document explaining the structure of the journal file and what gets inserted in it depending on the nature of the update. Part of MongoDB documentation says:
The journal record includes any internal write operations caused by the initial write. For example, an update to a document in a collection may result in modifications to the indexes; WiredTiger creates a single journal record that includes both the update operation and its associated index modifications.
This does not help much here. But to be fair, this journal mechanism is a rather internal process, so I wouldn’t blame MongoDB for not explaining much about the details in their public documentation.
There’s a command line utility (wt) that may be used to display the journal’s content in a human-readable format. But the version I can install on the MongoDB container (via apt-get update && apt-get install wiredtiger) somehow fails to open the MongoDB data folder. AI suggested that it might be due to a difference in WiredTiger’s version, and that I might have to compile WiredTiger from MongoDB’s source repository. I got a bit lazy and decided not to follow this course of action; but please let me know if you manage to make it work.
The quadratically-growing journal
But even without looking at the raw journal content, we can leverage the metrics MongoDB keeps track of, including metrics about WiredTiger’s journal. These can be accessed either programmatically, or using the mongo shell:
1$ mongosh mongodb://root:root@localhost:27017
2...
3
4test> db.serverStatus().wiredTiger.log
5{
6  'log bytes written': 4480,
7  // a lot of other metrics are omitted here
8}
So we can precisely measure how much data is actually written to the journal files. We can hence run an experiment: run the demo project twice with a different number of inserted timestamps, and see how much that impacts the amount of log bytes written:
 1$ ./target/release/linear-array-growth-db 10000
 2...
 3Let's now sequentially call $push on the same document 10000 times, starting at 12:18:26.947794
 4Done at 12:18:36.036745 in 9.114288583s
 5Bytes written in Wiredtiger journal: 283.7 MiB (~ 29750 x number of iterations)
 6...
 7
 8$ ./target/release/linear-array-growth-db 20000
 9...
10Let's now sequentially call $push on the same document 20000 times, starting at 12:20:26.519572
11Done at 12:20:50.475807 in 23.982442166s
12Bytes written in Wiredtiger journal: 1.2 GiB (~ 62445 x number of iterations)
13...
14
15$ ./target/release/linear-array-growth-db 40000
16...
17Let's now sequentially call $push on the same document 40000 times, starting at 12:21:31.976415
18Done at 12:22:43.678363 in 71.738671792s
19Bytes written in Wiredtiger journal: 4.9 GiB (~ 131520 x number of iterations)
20...
This clearly shows the quadratic growth: doubling the number of inserted timestamps (from 10,000 to 20,000) resulted in 4× more data written to the log, and quadrupling it (from 10,000 to 40,000) resulted in 16× more.
As mentioned above, I do not have documentation to back this up, but I assume that every time we $push an element in the array, the whole array gets written to the journal log. Hence, in our little experiment, after pushing N timestamps in the array, the document in database looks like:
1{"timestamps": [t1, t2, ..., tN]}
And the data in the journal looks like:
1New value of timestamps: [t1]
2New value of timestamps: [t1, t2]
3...
4New value of timestamps: [t1, t2, ..., tN]
So that means that even though the size of the data scales linearly with N, the journal’s size actually scales quadratically with N. This explains how this trivial-looking example can generate gigabytes of data written to disk.
Let’s pause for a brief moment here, and think about how bad this could get. We’ve seen that linearly growing the timestamps array of a single document can write gigabytes of data to disk, but disk usage might not be our main concern here: WiredTiger allegedly keeps a maximum of 2GB of journal files4, so the journal files should not pile up and eventually fill your disk. However, the main purpose of these journal files is to buffer updates between checkpoints, in order to limit the frequency of data being flushed to disk. By dramatically increasing the amount of data in WiredTiger’s journal, the linearly growing array pattern we have explored here will increase the disk writes (for journal files as well as data files). Whether or not this has a measurable impact on a production database will likely depend on too many parameters, such as the array’s update frequency. But remember that the figures above come from a test updating a single document, with less than 100,000 elements in the array, and an overall size of less than 1MB. So I wouldn’t be surprised if running something similar with a few hundred concurrent jobs took down a production deployment.
Different behaviour in a replica set
If you’re running MongoDB in production, there’s a fair chance you’re not running a single-node deployment, but rather using a replica set. Replica sets rely on something called the oplog, which keeps a rolling record of write operations on the primary node. The main purpose of this oplog is to allow the secondary nodes of the replica set to apply the same operations (asynchronously).
The idea behind this oplog looks rather similar to WiredTiger’s write-ahead log, as both are supposed to contain the sequential list of write operations performed on the DB; but they operate at different levels:
- WiredTiger’s journal is managed by the storage engine on each individual node;
- the oplog is managed by MongoDB, which updates its content on the replica set’s primary node, and asynchronously replicates its content to the secondary nodes.
So instinctively these are orthogonal concerns, and I would assume that the content of WiredTiger’s journal would be the same for a standalone node and for a replica set member.
And once again, my intuition fell short.
We can turn our single-node mongodb deployment into a (single-node) replica set by running the mongod process with the additional argument --replSet rs0, and running rs.initiate() in the mongo shell after the DB process has started (refer to the README for more precise instructions). Once this is done, the node will be running as the primary node of the replica set, and among other things, it will start maintaining an oplog. We can then re-run the demos project’s test code:
# First run: standalone node
$ ./target/release/linear-array-growth-db
Are we targeting a replica set? false

Let's start by sequentially inserting 10000 documents, starting at 15:59:33.823060
Done at 15:59:42.092816 in 8.26878575s
Bytes written in Wiredtiger journal: 1.2 MiB (~ 128 x number of iterations)
Insert count: 20000
Modify count: 0

Let's now sequentially call $push on the same document 10000 times, starting at 15:59:52.163634
Done at 16:00:06.875997 in 14.750077959s
Bytes written in Wiredtiger journal: 289.8 MiB (~ 30384 x number of iterations)
Insert count: 10006
Modify count: 0


# Second run: replica set
$ ./target/release/linear-array-growth-db
Are we targeting a replica set? true

Let's start by sequentially inserting 10000 documents, starting at 16:01:19.110947
Done at 16:01:31.221597 in 12.109896916s
Bytes written in Wiredtiger journal: 4.9 MiB (~ 512 x number of iterations)
Insert count: 50012
Modify count: 0

Let's now sequentially call $push on the same document 10000 times, starting at 16:01:41.294653
Done at 16:01:58.583939 in 17.320993667s
Bytes written in Wiredtiger journal: 4.9 MiB (~ 512 x number of iterations)
Insert count: 30082
Modify count: 18187
First we can see that sequential insertion of documents in the replica set generates around 4 times more journal data than a standalone node. That’s because the oplog itself is implemented as a (capped) collection, similar to the collections used to store data. So whenever a new document is inserted in a collection, an “operation” document is also inserted in the oplog collection, which itself is backed by WiredTiger’s journal.
But the most surprising difference lies in the second part of the test, which is the sequence of $push into an array. When running the test with a replica set, the amount of data written to WiredTiger’s journal is actually similar to the sequential insertion test, and does not scale quadratically anymore! By inspecting additional metrics, we can actually see that:
- in the standalone test, the 10,000
$pushoperations resulted in roughly 10,000 insertions, which means 10,000 full document rewrites, as we suspected earlier; - in the replica set test, the same 10,000
$pushoperations resulted in roughly 18,000 modifications, as well as 30,000 insertions.
I assume the insertions in the latter case are related to insertions in the oplog itself. But the main point here is that “switching” to a replica set has somehow made MongoDB decide to save document modifications, rather than full document rewrites, in WiredTiger’s journal. Some AI-assisted research pointed me to this part of MongoDB’s source code, which suggests that MongoDB attempts to use WiredTiger’s wiredTigerCursorModify only for replicated collections. I did not dig too deep, but this seems consistent with what we observed.
Takeaway
It took quite a while to get there, but I hope you enjoyed the journey. We’ve seen that linearly growing an array using the $push operator could result in quadratic write IO, because the full document seems to be stored in WiredTiger’s journal whenever an element is pushed. But somehow this behavior changed for a replica set: in that case, MongoDB ends up storing deltas (rather than full document rewrites) in WiredTiger’s journal.
My takeaways from this trip would be:
- MongoDB arrays are tricky: an array’s elements are handled very differently from individual documents in a collection. Be careful with “large” arrays, way below the size limit of 16MB mentioned in the official documentation, and be careful about frequent updates.
- There are non-obvious interactions between the deployment topology (single node vs replica set) and the behaviour of the storage engine. We have uncovered one of them here, but there might be others.
So if you’re thinking of using arrays with MongoDB, the best approach is (as always) to test your use-cases, using the same topology you expect to run in production.
What about RDBMS ?
Many “traditional” RDBMS have introduced some kind of support for JSON-valued columns and associated operators in the last decade. I haven’t tried using these yet, but as far as I can see, they have followed slightly different approaches: the JSON data type seems to be an alias for LONGTEXT in MariaDB, while pgsql seems to have a dedicated binary data type. It might be interesting to run the same test scenario with these databases and see how it impacts their performance; but that will be for another blog post.
-
the data type supported by MongoDB, called BSON, actually supports slightly more types than the JSON format, but that won’t matter here ↩︎
-
the code in the demos repository actually does that: it first runs
Ndocument insertions (whereNis the given argument, with a default value of 10k), then runsN$pushoperations on a single document right after, so that you can compare the two scenarios ↩︎ -
if you pay attention to the time on the X-axis of the below screenshot, you’ll see that it actually includes the previous graph (between 15:08:30 and 15:09:00), showing IO and disk usage during sequential insertion. But these are completely negligible compared to the IO and disk usage of the sequential
$push, which ran between 15:09:10 and 15:11:00. ↩︎ -
which seems consistent with the drop in disk usage we saw during our test ↩︎